Portland Preparedness Data Almanac
x
2024 PBEM Volunteer Data
2024 General Data
| Total volunteer hours [1] | Q1 | Q2 | Q3 | Q4 | YEAR TOTAL |
| 5,675 | 7,865 | 4,353 | 7,159 | 25,053 | |
| Deployment/Program Service hours [2] | 2,743 (11%) | ||||
| Basic NET Training hours [3] | 5,142 (21%) | ||||
| Advanced NET/Exercise hours [4] | 6,476 (26%) | ||||
| BEECN/Amateur Radio hours [5] | 4,943 (20%) | ||||
| Community Engagement hours [6] | 5,747 (23%) | ||||
| Pareto number [7] | 12.17% | 15.61% | 8.48% | 13.71% | 25.32% |
| Total dollar inputs (not including staff) | $122,361 ($40,703 general fund / $81,658 grants) | ||||
| Volunteer hours value | $810,933 | ||||
2024 Significant Events
 |
There is an expanding table here! Click "Expand" to see the data. |
| Date | Event | Type | Notes |
|---|---|---|---|
| 2024.11.30 | Scenario Village: Operation Wheeler | Training/Exercise | |
| 2024.11.16 | BEECN Exercise | Training/Exercise | |
| 2024.11.02 | Unidos Contra Desastres food distribution | Deployment | Unidos Contra Desastres partnered with Safe Blocks to distribute food boxes in Cully. |
| 2024.10.29 | Citywide Deployment Exercise | Training/Exercise | |
| 2024.10.29 | IronOR DAMM Exercise | Training/Exercise | |
| 2024.10.19 | Basic NET class | Training/Exercise | Held in Homestead Neighborhood. Graduated 65 |
| 2024.10.05 | Rosewood Initiative Disaster Prep class series | Training/Exercise | Delivered in Spanish |
| 2024.09.14 | NETCamp 2024 | Training/Exercise | 19 classes over 2½ days. |
| 2024.07.27 | Latino NET en Cully rechristened Unidos Contra Desastres | Programming | The name change reflects that we are expanding Spanish programming beyond Cully. |
| 2024.07.10 | City Council marks NET's 30th anniversary | Programming | Event included presentation and proclamation. |
| 2024.06.05 | Introduction of Adobe Lightroom to manage NET and BEECN photos | Programming | |
| 2024.06.01 | Friends of Portland NET 30th Anniversary NET Breakfast | Programming | |
| 2024.06.01 | Portland Rose Festival | Deployment | NETs serving as Parade Guides and as first aid auxiliaries. |
| 2024.05.04 | Basic NET class | Training/Exercise | 58 NETs graduated by 06/09. |
| 2024.04.27 | Scenario Village: Operation Kalapuya | Training/Exercise | |
| 2024.04.27 | Citywide Deployment Exercise | Training/Exercise | |
| 2024.04.18 | Trainingpalooza! | Training/Exercise | 18 classes instructing Wilderness First Aid and other medical response topics. Was also an opportunity to train new instructors. |
| 2024.01.24 | Retirement of Ernie Jones, PBEM's BEECN Coordinator | People | Ernie was PBEM's BEECN Coordinator. Due to budget cuts, his position was not refilled. |
| 2024.01.13 | Basic NET class | Training/Exercise | 53 NETs graduated by 02/11. |
| 2024.01.13 | NET deployment in response to major winter storm | Deployment | First field test of the DAMM. |
| 2024.01.06 | BEECN drill with twelve BEECN resources | Training/Exercise | |
| 2024.01.06 | TeenCERT programming transferred to Multnomah County in response to budget cuts | Programming |
2024 Program Activity Data
| Volunteer Deployments | |
|---|---|
| Deployment events | 10 |
| Estimated deployment hours | |
| Basic NET Training | |
|---|---|
| Basic NET classes | 3 |
| Graduates | 176 |
| Basic BEECN Training | |
|---|---|
| Basic BEECN classes | 11 |
| Seats | 307 |
| Advanced Training/Exercises | |
|---|---|
| Advanced training events | 85 |
| Seats | 2,149 |
| In person seats / Online class seats | 1,236 / 913 |
COAD members
Training events in Spanish
Classes (and hours?) in Spanish
2024 BEECN Readiness Data

| BEECN Readiness Scores | |
| 2024 Start | January 1, 2024
35.52% |
| 2024 Midyear | July 2, 2024
20.30% |
| 2024 Maximum | January 10, 2024
37.89% |
| 2024 End | December 31, 2024
26.56% |
| BEECN Volunteers at the close of 2024 | ||

|
BEECN Volunteers (non-ARO) | 351 |
| Amateur Radio Operators (AROs) assigned | 34 | |
| Fire stations with 2+ assigned AROs | 10 | |
| Fire stations with one assigned ARO | 9 | |
| Fire stations with zero assigned AROs | 15 | |
| Fire stations with no AROs assigned will not be able to activate or relay the messages transmitted by their assigned BEECNs. Having two AROs assigned is optimal; one is risky. |
2024 Volunteer Hours by District
| District
Population |
Volunteers | Hours | Logged % | Pareto | MSC [8] | |||||||||||||
|---|---|---|---|---|---|---|---|---|---|---|---|---|---|---|---|---|---|
| Q1 | Q2 | Q3 | Q4 | Q1 | Q2 | Q3 | Q4 | TOTAL | Q1 | Q2 | Q3 | Q4 | Yearlong | ||||
 |
District 1 | 148,117 [9] | 86 | 90 | 89 | 94 | 395 | 639 | 310 | 378 | 1,722 | 38.4% | 14.0% | 34.4% | 13.3% | 25.8% | 9.0% | 30.9% | 14.0% | 47.8% | 22.3% | 37.2% |
 |
District 2 | 143,013 [10] | 435 | 459 | 457 | 469 | 1,242 | 2,210 | 962 | 1,390 | 5,805 | 25.5% | 9.2% | 26.8% | 11.8% | 20.4% | 6.6% | 24.3% | 9.2% | 39.2% | 16.8% | 28.1% |
 |
District 3 | 153,705 [11] | 355 | 369 | 368 | 383 | 1,331 | 1,819 | 1,184 | 1,796 | 6,131 | 34.4% | 11.0% | 35.0% | 13.6% | 22.3% | 4.3% | 30.5% | 12.5% | 47.5% | 19.3% | 35.5% |
 |
District 4 | 139,967 [12] | 480 | 493 | 490 | 504 | 2,540 | 2,906 | 1,796 | 3,304 | 10,545 | 42.1% | 15.6% | 37.1% | 12.6% | 27.6% | 9.4% | 36.7% | 11.5% | 52.4% | 21.4% | 40.9% |
2024 Hours by Neighborhood
Data definitions/parameters: A "volunteer" on these tables is an Active NET, BEECN, or ATV. Hour quantities are rounded. The number of volunteers is the number listed active in that dataset at the end of the year, while hours are accumulated over the course of a calendar year.
Possible data discrepancies: Some Portland neighborhoods are divided between districts (Brooklyn for example, occupying districts 3 and 4). In the tables below, all neighborhoods are grouped once under a single district. Therefore, totals here may be slightly different than what is found in 2024 Volunteer Hours by District. Volunteers trend towards under-reporting their volunteer hours.
| District 1 | ||
|---|---|---|
| Neighborhood | Volunteers | Hours |
| Argay | 6 | 366 |
| Centennial | 15 | 245 |
| Glenfair | 1 | 0 |
| Hazelwood | 15 | 370 |
| Lents | 20 | 179 |
| Mill Park | 2 | 0 |
| Parkrose | 6 | 147 |
| Parkrose Heights | 3 | 0 |
| Pleasant Valley | 6 | 24 |
| Powelhurst-Gilbert | 15 | 218 |
| Russell | 3 | 65 |
| Sumner | 1 | 0 |
| Sunderland | 1 | 0 |
| Wilkes | 4 | 78 |
| Woodland Park | 1 | 0 |
| District 2 | ||
|---|---|---|
| Neighborhood | Volunteers | Hours |
| Alameda | 16 | 98 |
| Arbor Lodge | 20 | 358 |
| Beaumont-Wilshire | 16 | 182 |
| Boise | 15 | 223 |
| Bridgeton | 7 | 2 |
| Cathedral Park | 7 | 675 |
| Concordia | 26 | 124 |
| Cully | 65 | 163 |
| East Columbia | 1 | 0 |
| Eliot | 8 | 54 |
| Grant Park | 18 | 256 |
| Hayden Island | 6 | 26 |
| Hollywood | 7 | 156 |
| Humboldt | 9 | 125 |
| Irvington | 35 | 332 |
| Kenton | 22 | 235 |
| King | 17 | 155 |
| Lloyd District | 5 | 33 |
| Overlook | 20 | 271 |
| Piedmont | 18 | 58 |
| Portsmouth | 13 | 148 |
| Sabin | 14 | 451 |
| St. Johns | 40 | 961 |
| Sullivan's Gulch | 13 | 132 |
| University Park | 13 | 347 |
| Vernon | 6 | 81 |
| Woodlawn | 22 | 161 |
| District 3 | ||
|---|---|---|
| Neighborhood | Volunteers | Hours |
| Brentwood-Darlington | 21 | 501 |
| Brooklyn | 6 | 21 |
| Buckman | 16 | 103 |
| Creston-Kenilworth | 22 | 685 |
| Foster-Powell | 17 | 225 |
| Hosford-Abernethy | 20 | 34 |
| Kerns | 16 | 207 |
| Laurelhurst | 19 | 487 |
| Madison South | 10 | 125 |
| Montavilla | 29 | 321 |
| Mt. Scott-Arleta | 19 | 529 |
| Mt. Tabor | 30 | 835 |
| North Tabor | 8 | 35 |
| Richmond | 33 | 424 |
| Rose City Park | 23 | 286 |
| Roseway | 19 | 189 |
| South Tabor | 11 | 99 |
| Sunnyside | 23 | 139 |
| Woodstock | 34 | 774 |
| District 4 | ||
|---|---|---|
| Neighborhood | Volunteers | Hours |
| Ardenwald-Johnson Creek | 1 | 15 |
| Arlington Heights | 14 | 32 |
| Arnold Creek | 14 | 47 |
| Ashcreek | 17 | 197 |
| Bridlemile | 22 | 363 |
| Collins View | 30 | 829 |
| Crestwood | 2 | 14 |
| Eastmoreland | 10 | 47 |
| Far Southwest | 6 | 58 |
| Forest Park | 8 | 109 |
| Goose Hollow | 10 | 95 |
| Hayhurst | 16 | 227 |
| Healy Heights | 0 | 0 |
| Hillsdale | 19 | 460 |
| Hillside | 3 | 0 |
| Homestead | 29 | 853 |
| Linnton | 9 | 116 |
| Maplewood | 13 | 1,127 |
| Markham | 9 | 27 |
| Marshall Park | 10 | 176 |
| Multnomah | 27 | 589 |
| Northwest District | 34 | 539 |
| Northwest Heights | 13 | 353 |
| Old Town-Chinatown | 2 | 0 |
| Pearl District | 21 | 574 |
| Portland Downtown | 23 | 156 |
| Reed | 2 | 2 |
| Riverdale | 5 | 174 |
| Sellwood-Moreland | 35 | 485 |
| South Burlingame | 16 | 658 |
| South Portland | 17 | 64 |
| Southwest Hills | 17 | 1,045 |
| Sylvan-Highlands | 10 | 85 |
| West Portland Park | 11 | 130 |
2024 Photo Gallery
-
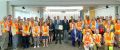 Portland City Council celebrates NET's 30 Year Anniversary.
 -
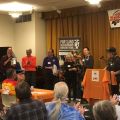 PBEM's Jeremy and Glenn receiving recognition plaques during Friends of Portland NET's 30 year NET Anniversary party on June 1. Photo by Katy Wolf.
 -
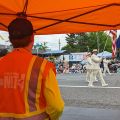 NET volunteering at Grand Floral Parade first aid station on June 8. Photo by Roger Wirt.
 -
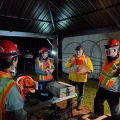
 Centennial NET conducting an operations exercise on July 27. Photo by Karen Wolfgang.
 -
 NETs and CERTs practicing survivor carries at NETCamp. Photo by Lisa Jamieson.
 -
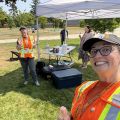
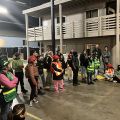
 Ashcreek NET participating in the Citywide Deployment Exercise on October 30.
 -
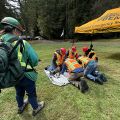
 NET Unidos Contra Desastres at Scenario Village on November 30. Photo by Marisol Lozano-Peralta.
 -
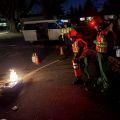 Woodstock NET practices with fire extinguishers on December 2. Photo by Mark Ginsberg.
 -
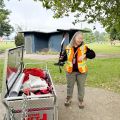 Christine Wilson inspecting a BEECN cache.
.jpg)

.jpg)
.jpg)
.jpg)
.jpg)
.jpg)
.jpg)

How to Read the Statistics
This section guides readers on how to read and interpret the numbers that are not straightforward.
Logged %
Indicates the percentage of volunteers in the subject dataset that logged any hours at all (x > 0).
Pareto Numbers
Pareto Numbers are based on the Pareto Principle; the notion that for many outcomes, roughly 80% of consequences come from 20% of causes. For volunteer purposes, it is an index of volunteer activity. In strict mathematical terms, the Pareto Number indicates what percentage of active volunteers are logging 80% of the volunteer hours. If your NET community is a beehive, the Pareto Number answers: how loudly is that beehive buzzing?
The number indexes volunteer community activity in the respect that a low number would indicate very few active volunteers are actually engaged with programming. This would imply several prospective problems in that volunteer community, not the least of which include:
- Low volunteer activity;
- A small "hard core" of volunteers burning themselves out carrying the activity and volunteer labor of the other volunteers;
- A volunteer roster populated with inactive volunteers;
- A volunteer community where few of the volunteers know each other or regularly work together (particularly troublesome for disaster response volunteers).
Example: A Tale of Two Teams
Let's say there are two teams: Team 1 and Team 2. Each has ten volunteers. In a year, Team 1 logged 105 hours and Team 2 logged 100 hours. On the face of it, those numbers might suggest Team 1 was slightly more active than Team 2 in that year. But if we pull the hours of each individual team member, the picture looks like this:
| Team 1 | Team 2 | ||
|---|---|---|---|
| Volunteer | Hours | Volunteer | Hours |
| Vol. 1a | 85 | Vol. 2a | 20 |
| Vol. 1b | 6 | Vol. 2b | 17 |
| Vol. 1c | 5 | Vol. 2c | 15 |
| Vol. 1d | 3 | Vol. 2d | 15 |
| Vol. 1e | 3 | Vol. 2e | 12 |
| Vol. 1f | 0 | Vol. 2f | 11 |
| Vol. 1g | 0 | Vol. 2g | 7 |
| Vol. 1h | 0 | Vol. 2h | 3 |
| Vol. 1i | 0 | Vol. 2i | 0 |
| Vol. 1j | 0 | Vol. 2j | 0 |
80% of each team's hours is 84 and 80, respectively. On Team 1, one volunteer accomplished that portion. On Team 2, five volunteers made up 80% of the hours. So in this example, Team 1 has a Pareto score of 10% and Team 2 has 50%. Even though Team 1 logged more hours, Team 2 is distributing more of the weight of the work amongst themselves. This could mean that Team 2 is more resilient to volunteer burnout and has denser collaborative relationships.
This is not to denigrate the effort of "super volunteer" on Team 1 (who is also probably the Team Leader). We love super volunteers and appreciate their work! But if we need to evaluate the health of a team, we would encourage that volunteer to ask their teammates for help, or plan with PBEM how to get those volunteers more involved. A small number of volunteers should not be asked to carry the resilience effort of a whole neighborhood; that is simply too much. There are also five volunteers on Team 1 who logged zero hours. The Team Leader may want to ask PBEM if those volunteers are still active in the program.
Yearlong vs. Quarterly Pareto Numbers
This Wiki article references both annual ("Yearlong") and quarterly Pareto Numbers for Portland Districts. However, only the annual number is really important; quarterly figures are more of a curiosity and do not really say much about overall team activity.
MSC: Minimum Service Contribution
This metric indicates what percentage of active volunteers in the dataset made their Minimum Service Contribution of twelve logged hours in a year.
Notes and References
- ↑ All hour totals represent the number of hours logged by volunteers. Actual volunteer hours are underreported.
- ↑ Deployment hours represent hours spent responding to an emergency incident. Service hours represent hours that directly improve programming, such as through instruction, event planning, filming training videos, writing articles, and so on.
- ↑ Hours spent either in Basic NET Training, or hours refreshing basic volunteer skills (e.g. an Active NET volunteer re-taking Basic NET Training).
- ↑ Hours in advanced training courses or in response exercises.
- ↑ Any hours related to BEECN or amateur radio activities by PBEM volunteers.
- ↑ Community engagement hours include NET team meetings, community presentations, NET Team Leader responsibilities, tabling at events, etc.
- ↑ The "Pareto number" (based on the Pareto Principle) is an index of volunteer activity. It is one method for measuring how active PBEM volunteers are. The number is the percentage of active PBEM volunteers who contributed 80% of the reported volunteer hours. A higher number is a higher representation of activity (so: the higher the number, the better). A program with consistently low Pareto numbers is probably not sustainable, as that would indicate a very small number of volunteers doing almost all of the work.
- ↑ Minimum Service Contribution.
- ↑ From: https://www.portland.gov/civic/documents/district-1-profile-2023/download
- ↑ From: https://www.portland.gov/civic/documents/district-2-profile-2023/download
- ↑ From: https://www.portland.gov/civic/documents/district-3-profile-2023/download
- ↑ From: https://www.portland.gov/civic/documents/district-4-profile-2023/download